What is the article about?
In the last post we described what our goals in implementing learning to rank (LTR) are and how we intend to achieve them (methodically). But how do we actually get the data we need? How do we identify the ranking order that will create the greatest value for our customers? What exactly is “value”/relevance from a customer’s perspective? And how do we define features to correctly represent that data? We will try to answer some of these questions in this post. Subsequent posts will deal with how we measure search quality and how we realized technical implementation of an LTR pipeline.
Creating Labeled Data
So how do we define relevance and how can we determine the perfect ordering of products from a customer's perspective? We need to create labeled data. The usual approach in Data Science is crowd sourcing, meaning handcrafted labeling by an (as large as possible) group of people. The challenge in ecommerce is that “relevance, with the intention to buy something” differs from the mere question of “How relevant is this product to this query?”. Thus, we should not use crowd sourced data for training. Instead, we must deduce relevance from customer interactions we collect on our website every day. The most common KPIs for this are clicks, add4laters (add-to-carts and add-to-wish-lists), orders and revenue, but other metrics might also be helpful for determining relevance from a customer’s point of view. As mentioned in the previous post (#1 Introduction in Learning to Rank for E-Commerce Search), those could also be describing customer activity on the product detail page or the search result page, the time spend on a detail page or the time passing between clicks/scrolling/reading/...
Optimization Goal
Once we have collected the aforementioned data, we must decide on which to use as basis for the target metric (called Judgements) for our LTR model. We do so by conducting experiments during which we show 50% of our customers a ranking based on Judgement calculation approaches, while the other 50 percent see the status quo. Thus we can determine whether or not the target metric selected is a good definition of relevance.

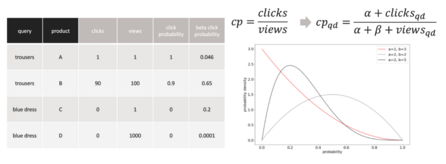
Our current approach for calculating the target metric is to model the click probability for a product, given a query. We consider clicks and views of products and compute click probabilities (clicks/views ~ click-probability). As you can see in fig. 1, using solely clicks and views to calculate a click probability leads to unhelpful results, especially for low view numbers. To give products with more interaction higher statistical significance we apply a Bayesian probability method. Since we are regarding the binomial probability distribution of a product being clicked (=1) or not (=0), we can model the prior probability distribution with the Beta distribution. We determine the Beta distribution parameters from historic interaction data. For each query-product pair we modify the prior with the observed clicks and non-clicks to get a better estimate of the click probability (see fig. 1).
Position Bias
An additional challenge in collecting data on ranked products is the position bias. We are currently testing different approaches on how to compensate for it by estimating its magnitude and applying inverse probability weighting based on this value. In particular we estimate the underlying function of the position bias and debias interaction data with that. Another approach is to calculate click probabilities or beta distribution priors per position and estimate the position bias by looking at their differences for products appearing on differing positions in history. Approaches in recent literature try to incorporate the position bias directly into the learning to rank model and thus let the model learn its influence on data. We will test such approaches in future iterations.

Choosing the right features
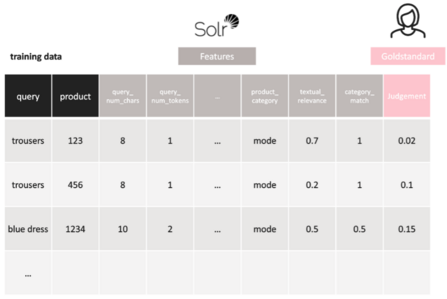
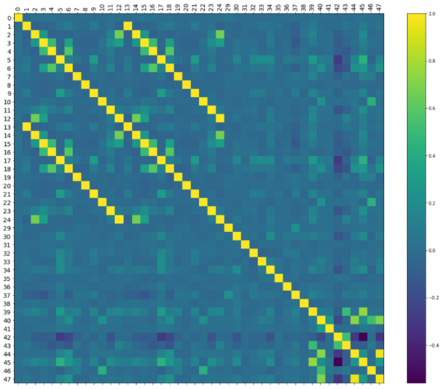
Once we have defined the target metric to use, we can focus on getting the right features to train our model. Currently used features are query-dependent, product-dependent and describing query-product relations (see fig. 2). We start off with an educated guess, based on our business knowledge. From that point on we are iterating, looking at feature correlations and model performance (see fig. 3). For the future we would also like to include personalization features, like age or gender and real-time features like time of day or day of the week.

If these topics sound interesting to you and/or you have experience in building LTR models and designing features or judgements, we would be happy to discuss ideas with you or welcome you to our team -> contact us at JARVIS@otto.de.
0No comments yet.
Written by

Similar Articles
 COSTNovember 12, 2024
How we used a simple trick to save USD 500,000 in data transfer costs
16Increased efficiency of cloud usage ✓ Cost reduction ✓ Migration to dual-stack IPv6 ✓ Find out more now!DevelopmentCloud DominikSeptember 30, 2024
Developer Hacks – Modern Command Line Tools and Advanced Git Commands
114In this article, you learn more about a modern development setup, state-of-the-art alternatives to classic shell programs, and advanced git commands.DevelopmentWorking methods


